‘[A] potentially vulnerable sector globally’
That’s how the Bank of England described commercial property in its March 2023 Financial Policy Committee meeting. Heightened risks are now receiving heightened attention. This follows the Reserve Bank of Australia (RBA) highlighting in its October 2022 Financial Stability Review that ‘CRE valuations are at risk of decreasing in the period ahead due to higher interest rates, tighter credit supply and macroeconomic uncertainty’.
How resilient are commercial property loan portfolios in a scenario where there is yield expansion and a tenancy recession (lower rental income) combined with higher interest rates? In this Risk Insights we cover:
- The data dilemma
- Segments matter
- Portfolio management
- Turning data and insights into opportunity

Risks are heightened
Commercial property valuation declines are yet to materialise given the lack of price discovery (no consistent recent sales data) for many market and geographic segments. In addition, a number of segments are experiencing elevated vacancy rates and lower market rents. What does this mean for potential refinancing risk and covenant breaches in these portfolios (i.e. will borrowers be able to refinance at underwriting standards for new originations)? Will they be able to remedy covenant breaches? How effectively are covenants being monitored?
Commonly accepted ‘rules of thumb’ that are used to predict the expected performance of residential and commercial real estate sectors are being severely tested. Unprecedented changes require a re-think of these rules in terms of how credit risks are managed and monitored going forward. There is considerable uncertainty about the financial position of small businesses which have been hardest hit by the pandemic, inflation, higher operating costs and higher interest rates, and the flow-on impacts for commercial real estate investment lending. Additionally, the pandemic has accelerated changes in the structural demand for office and retail space.
Lenders and investors with rich data and sophisticated portfolio management practices will be better positioned to navigate through this period of uncertainty – able to quickly identify opportunities to strategically adjust underwriting standards, policies and portfolio allocations with the requisite clarity and confidence.
The data dilemma
Do you have the data and systems to understand the rapid changes in underlying fundamentals that drive the performance of commercial real estate lending?
Unlike residential property, the performance characteristics for commercial real estate loans are not homogeneous. This introduces challenges for lenders and investors in providing portfolio-level performance and risk insights to management, boards, shareholders, and regulators, including the hardest hit segments. Two key challenges in commercial real estate lending are:
- identifying cohorts of collateral (that have economically homogeneous characteristics); and
- processing the data to provide greater insights into the likelihood of default and loss.
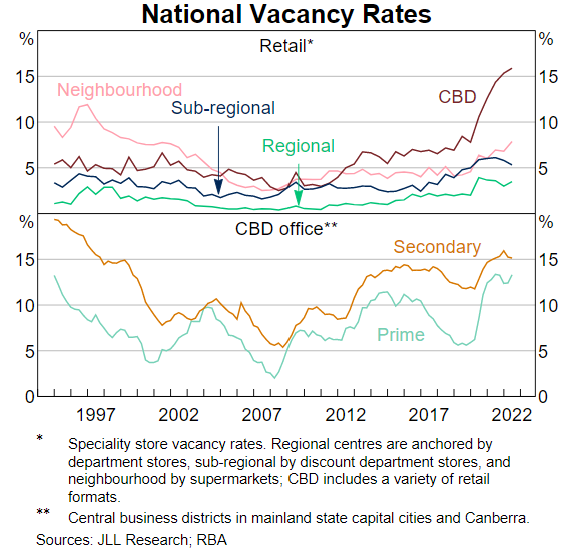
Some asset types, such as necessity-based retail tenants, food distribution and self-storage have performed strongly. Other asset types like non-necessity-based retail, backfill lower grade office and generally hospitality/hotels have performed poorly. Further, not all properties in the same asset type have identical performance characteristics when defined too broadly (e.g. retail, industrial, office, hotels).
Figure 1 from the RBA’s October 2022 Financial Stability Review shows how different vacancy rates for different retail property types have spiked.
Figure 1
Financial Valuation uncertainty is also a considerable challenge, especially for asset types and locations where there have been no recent comparable sale or leasing evidence. Valuers have struggled to substantiate rental income forecasts, discount rates and cap rates being used. Lenders should play close attention to the assumptions and the disclaimers used by valuers particularly when looking to extend new credit to borrowers and reviewing the impact of valuations on existing exposures. From a valuation perspective, cap rates and discount rates will become less relevant given the limited evidence available. What data is available and can it be substantiated? Rental income is likely to be the main factor that will drive valuations and provide comfort to lenders with limited sales evidence. Given this, it makes understanding and defining cohorts of asset types and tenants by economically homogeneous characteristics a priority for commercial real estate lenders.
Segments matter
Where are the risks of tenant recession likely in commercial real estate investment lending portfolios? Do you have the portfolio insights to know whether this will apply across all tenants and property types in your commercial property portfolios?
Despite the good news scenarios that often populate the headlines, businesses and tenants did experience cashflow stress during the pandemic. Businesses and tenants deferred rents, negotiated reductions in either rental rates or areas rented, changed intentions to renew or exercise options to take up additional space, and in some cases, tenants have shut up shop for good and walked away (leaving the rental deposit behind for the landlords).
Table 1 illustrates the impact of higher interest rates, higher asset yields and lower market rents on valuations, LVRs and ICRs. In this hypothetical example, an increase in asset yield by 1% (at levels still below historical highs) and decline in rents of 10% results in the LVR increasing from 65% to 85%. The ICR decreases from 2.73x to 1.06x based on BBSW 90 days (i.e. base rate used by many lenders) increasing from 0.10% to 4.20% p.a. (based on market outlook).
Many exposures originated in the recent past using “conservative” underwriting standards (e.g. LVRs of 65% and ICR above 2.50x) are at risk of not being repaid at maturity of the loan. Our hypothetical example shows that there will be borrowers that need to decrease leverage (pay down debt) ensuring that loans can be successfully refinanced at the underwriting standards for new loans. In some instances, the loans will be restructured or borrowers may need to sell assets to repay these loans.
Table 1: Hypothetical CRE loan example
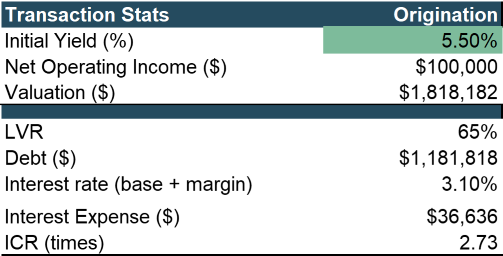
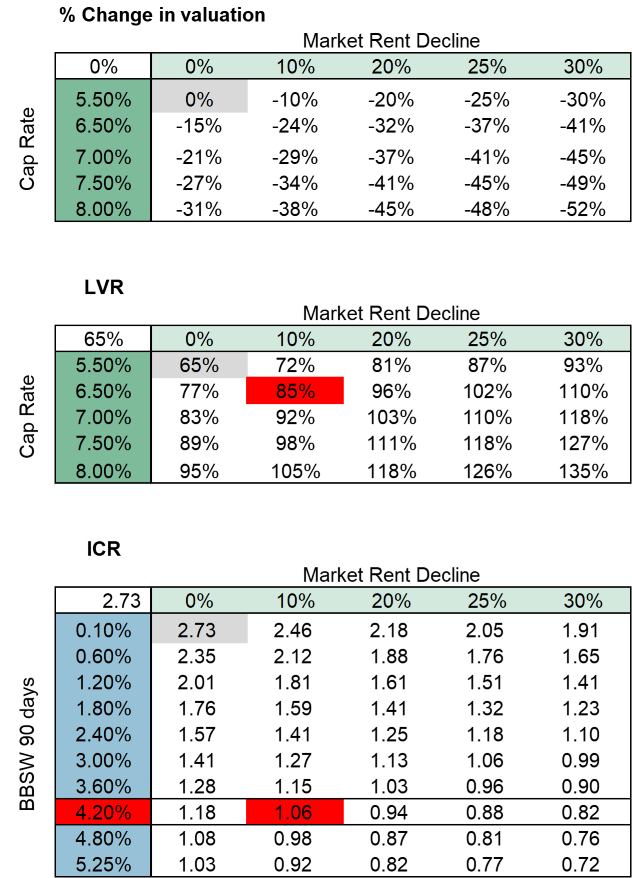
For example, changes in ICR and LVR metrics as illustrated in the hypothetical example in Table 1 would result in a substantial deterioration in the PD grade of this borrower. This would likely result in the exposure moving into Stage 2 or 3 provisioning and the change in provision amounts.
Portfolio management
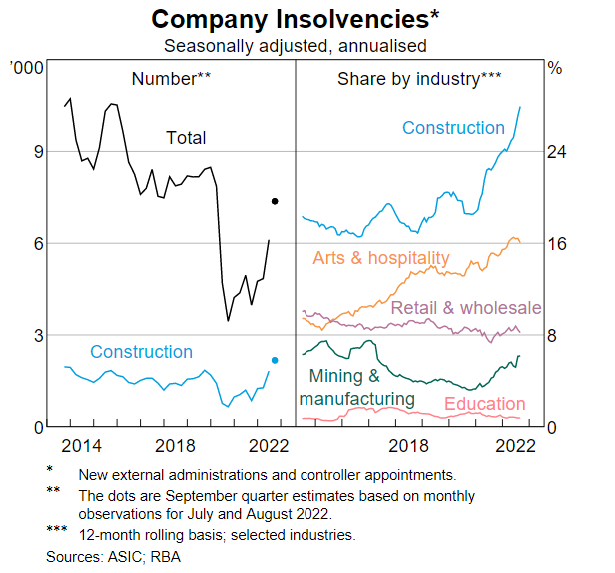
Noting the data limitations, for many lenders and investors it is not clear how exposed their portfolios are to these recent and ongoing changes. Rather, most recent reporting and disclosures have mainly focused on loan deferrals which has proven to provide a noisy picture of borrower stress. Insolvencies are also picking up, especially in construction, as shown in the RBA’s October 2022 Financial Stability Review and reproduced in Figure 2.
Figure 2
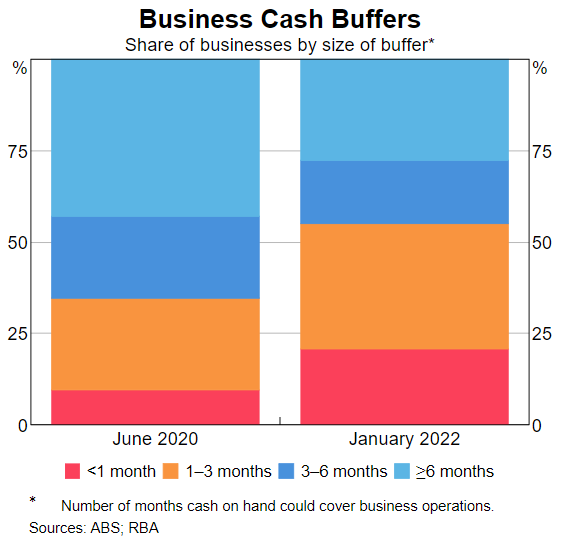
Some businesses also used the pandemic to re-negotiate agreements with landlords. And while early in 2020 business cash buffers increased, as shown in Figure 3 from the Reserve Bank of Australia’s April 2022 Financial Stability Review, less than 50% of businesses have sufficient buffers to cover operations for more than three months. The April 2023 data could tell a concerning story. How vulnerable are the loan portfolios exposed to tenants that are at a higher risk of failure?
Figure 3
Performance of specific sectors is still subject to uncertainty especially as government support packages for SMEs have expired, materially higher interest rates and structural demand for bricks and mortar retail and office space continues to rapidly change. The RBA also noted in its October 2022 Financial Stability Review that
‘some firms have been particularly affected by rising costs, labour shortages and supply disruptions and their profit margins are under pressure. Strains are acute in parts of the construction industry‘ and
‘in the commercial property sector, smaller landlords with lower quality properties and low liquidity may find themselves more exposed to cash flow strains’
It is in these segments that the lenders need to look deep, to understand the flow-on impacts in commercial real estate investment loan portfolios.
Portfolio management capabilities
What are the tenant dynamics in your underlying collateral portfolio?
Portfolio limit structures for commercial real estate lending vary by detail and approach. The Australian major banks have struggled to uplift data and management information systems. And how well are the large superannuation funds managing these risks and investing in the requisite capabilities? This has clear implications for the veracity of portfolio limits that govern the risk profile of commercial real estate lending portfolios. It also constrains the ability to deliver meaningful and timely insights. In it’s Insight Issue 4 2018: Strictly business: an update on commercial real estate lending APRA noted that in response to its CRE thematic review,
‘…banks had put in place tactical solutions to data and management information system gaps while preparing longer correction‘
It is unclear whether the Australian major banks or large superannuation funds have the capability to monitor performance of their commercial loan portfolios especially as they continue to struggle with multiple legacy systems.
On the other hand, UK banks were forced during the GFC to invest in data and systems to provide meaningful risk management insights to their shareholder (UK Government) and regulators. A key initiative was to capture and monitor data from rental schedules for collateral used to secure commercial real estate investment lending and aggregating this at portfolio level. This capability has allowed these banks to identify opportunities to grow market share as well as quickly identify clusters of higher risk exposures.
Portfolio management and risk insight is also challenged by the timeliness of data. Much of the information supporting current approaches is gathered at origination of a new loan, however, it quickly becomes stale soon after the loan is funded. In addition, annual reviews occur at least once every 12 months and are typically based on financial statements that can be over 12 months old.
Turning data into insight and opportunity
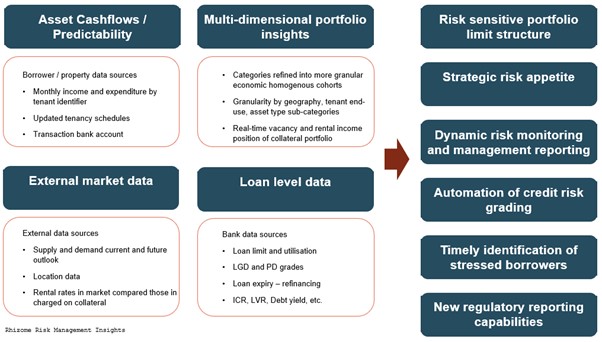
The diagram below provides a high level example of data that can be used to determine cohorts of collateral that have similar economic characteristics, timely identification of stressed or non-performing clusters, as well as being used to define risk appetite and lending strategy more effectively.
Figure 3
History has shown that during times of economic crisis and uncertainty, decisions made by large banks to tighten appetite or address portfolio concentrations has been based on imperfect or very broad assumptions of inherent risk profile. These have created temporary opportunities for small, responsive and more disciplined lenders and investors to grow market share and earn superior risk-adjusted returns.
Additionally, as lenders continue to revalue collateral for existing exposures any deterioration in collateral values may result in additional capital being held (through migration of exposures to higher risk-weights) by the banks that use the internal ratings based approach to calculating capital (i.e. the major banks). There is the potential that for some lenders, reducing exposures may be more beneficial from a return on equity perspective.
Continued evolution in approaches
Sophisticated lenders are now challenging the traditional assumptions used to cluster risk types. Some of these lenders are looking at geographic diversification not in terms of broad geographies (metro and non-metro) but rather in terms of smaller and economically homogeneous areas. A key competitive advantage is to understand how dynamics change (as it has very quickly), and enable the ability to target specific sectors of the market for new origination – especially those that might be over looked by other players with less-sophisticated approaches.
Practical steps to actively manage risks
- Increase monitoring of property performance by requesting frequent and up to date information including tenancy profiles to understand the underlying cashflows that support the servicing of debt but are also a driver of valuation.
- Early identification of borrowers showing signs of deteriorating cashflow (higher vacancies, lower rental income, mix of tenants, updated WALEs) which should trigger proactive discussions and plans to restore the borrower to health.
- Review and adjust underwriting standards for new loans. This includes appropriateness of maximum LVR and other debt sizing metrics contained in credit policy and underwriting standards especially if there is greater uncertainty contained in the valuation reports (e.g. use of special assumptions, lack of timely and reliable comparable sales and lease history, use of disclaimers etc).
- Review approaches to stress / scenario testing valuations for new credit assessments. This may include use of worse case (bottom of the cycle) asset yields / capitalisation rates to ensure that there is sufficient collateral coverage when there are concerns about the reliability of valuations (especially if declines in valuations / prices are likely to materialise over the next 12 to 18 months).
- Run a combined asset yield expansion and tenancy recession scenario across your portfolio to understand the vulnerabilities and put in place the right metrics that will drive action where it is necessary. Such vulnerabilities include potential migration in PDs and the impacts on regulatory capital and provisioning.
Rhizome has assisted banks with credit portfolio reviews including commercial property, small and corporate business lending, independent credit reviews consistent with requirements in APS 220 and APG 223, credit risk appetite design and lending strategies, reporting and review. This includes workshops with Boards and executive teams. We have an unparalleled understanding of APRA’s credit risk regulatory requirements and the practical implications of implementation.
Please reach out to us for more information.
This communication provides general information which is current at the time of production. The information contained in this communication does not constitute advice and should not be relied on as such. Professional advice should be sought prior to any action being taken in reliance on any of the information. Rhizome Advisory Group Pty Ltd shall not be liable for any errors, omissions, defects or misrepresentations in the information or for any loss of damage suffered by persons who use or rely on such information (including for reasons of negligence, negligent misstatement or otherwise).